Explora
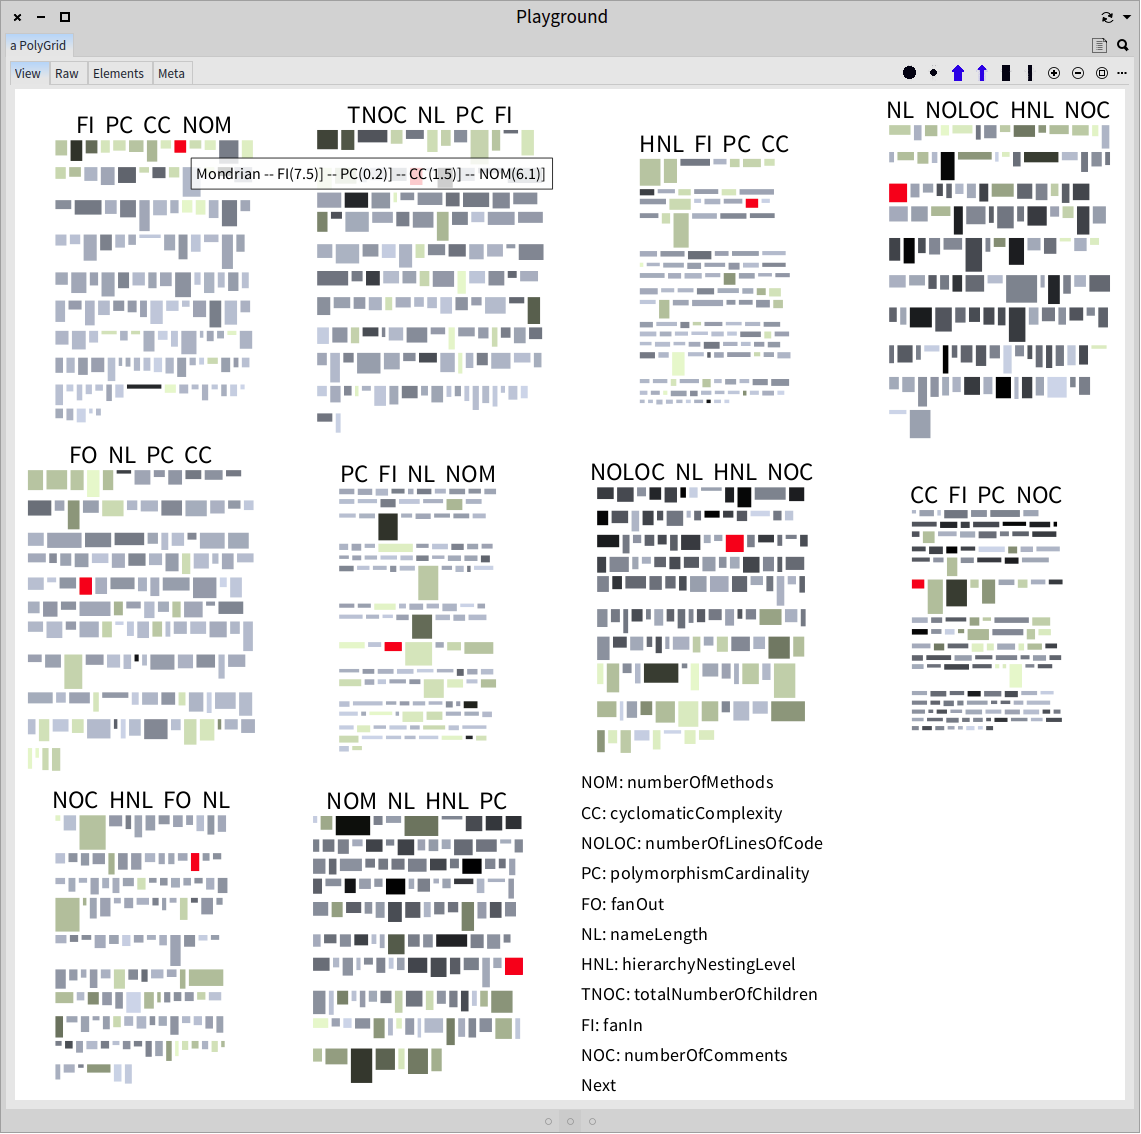
Explora is a visualisation tool designed for the simultaneous analysis of multiple metrics of software corpora. Explora incorporates a novel lightweight visualisation technique called PolyGrid that promotes the detection of graphical patterns. The figure below shows a PolyGrid for the analysis of ten metrics.
A PolyGrid is built as a grid of PolyCell. Each of them depicts the systems of the corpora by rectangles. At the top of the PolyCell a label describes (left-to-right) the metrics mapped to the position (left-to-right, top-to-bottom), height, width and colour intensity of rectangles. Note that each PolyCell maps a different metric to the position, which allows users to analyse all of them simultaneously. An analysis example can be launched by evaluating PolyGrid example in a Playground.
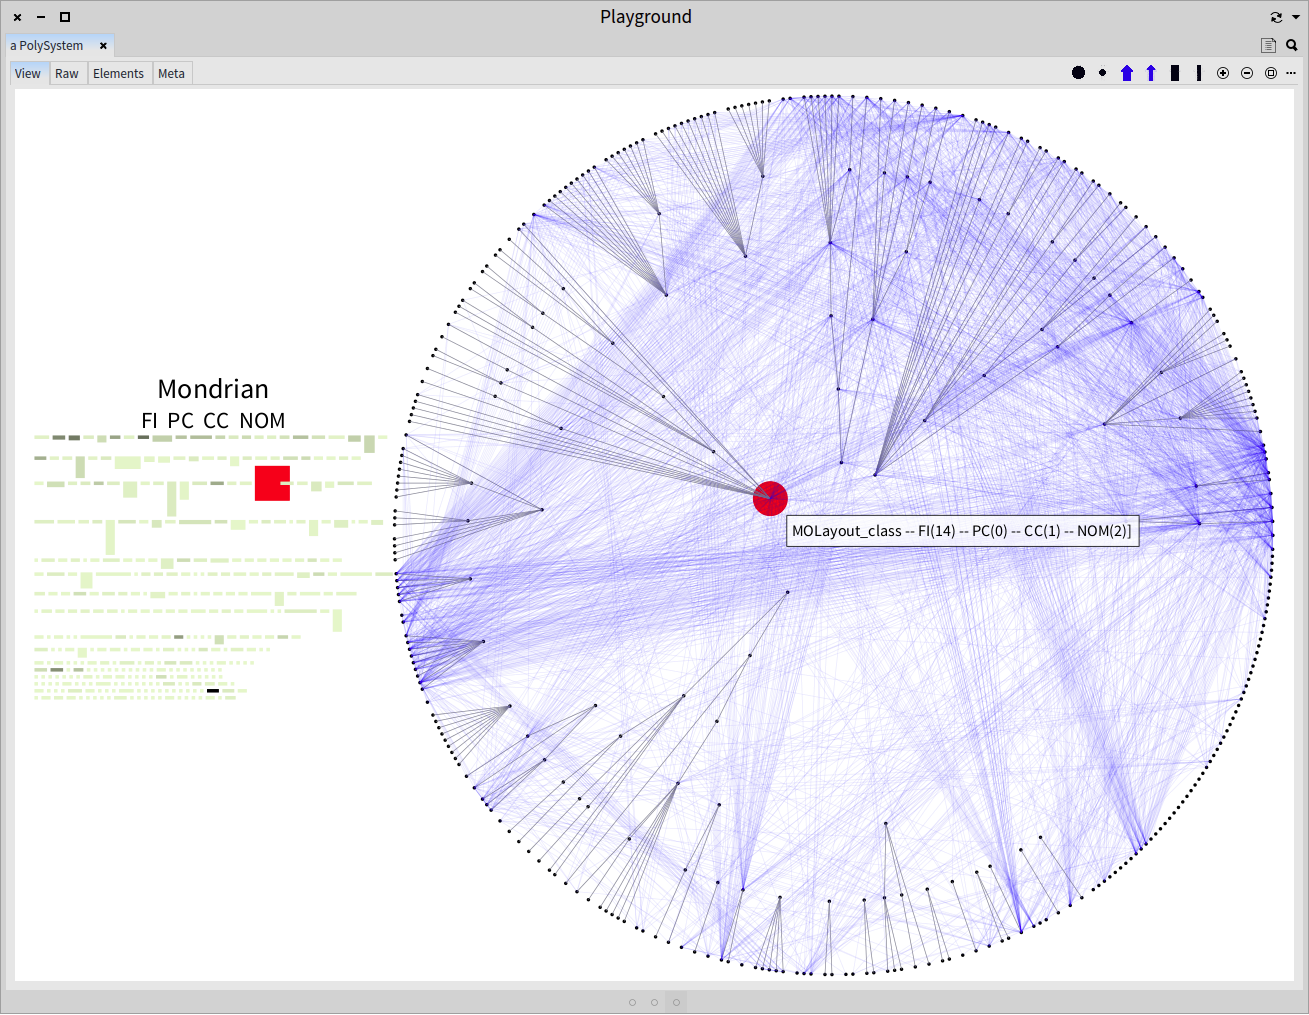
When users drill down into a system, Explora provides them a class-level visualisation that combines a polymetric view (see the Figure below on the left) for comparing metrics with a dependency graph (see the Figure below on the right) that shows inheritance and dependency relationships (grey and blue edges respectively).
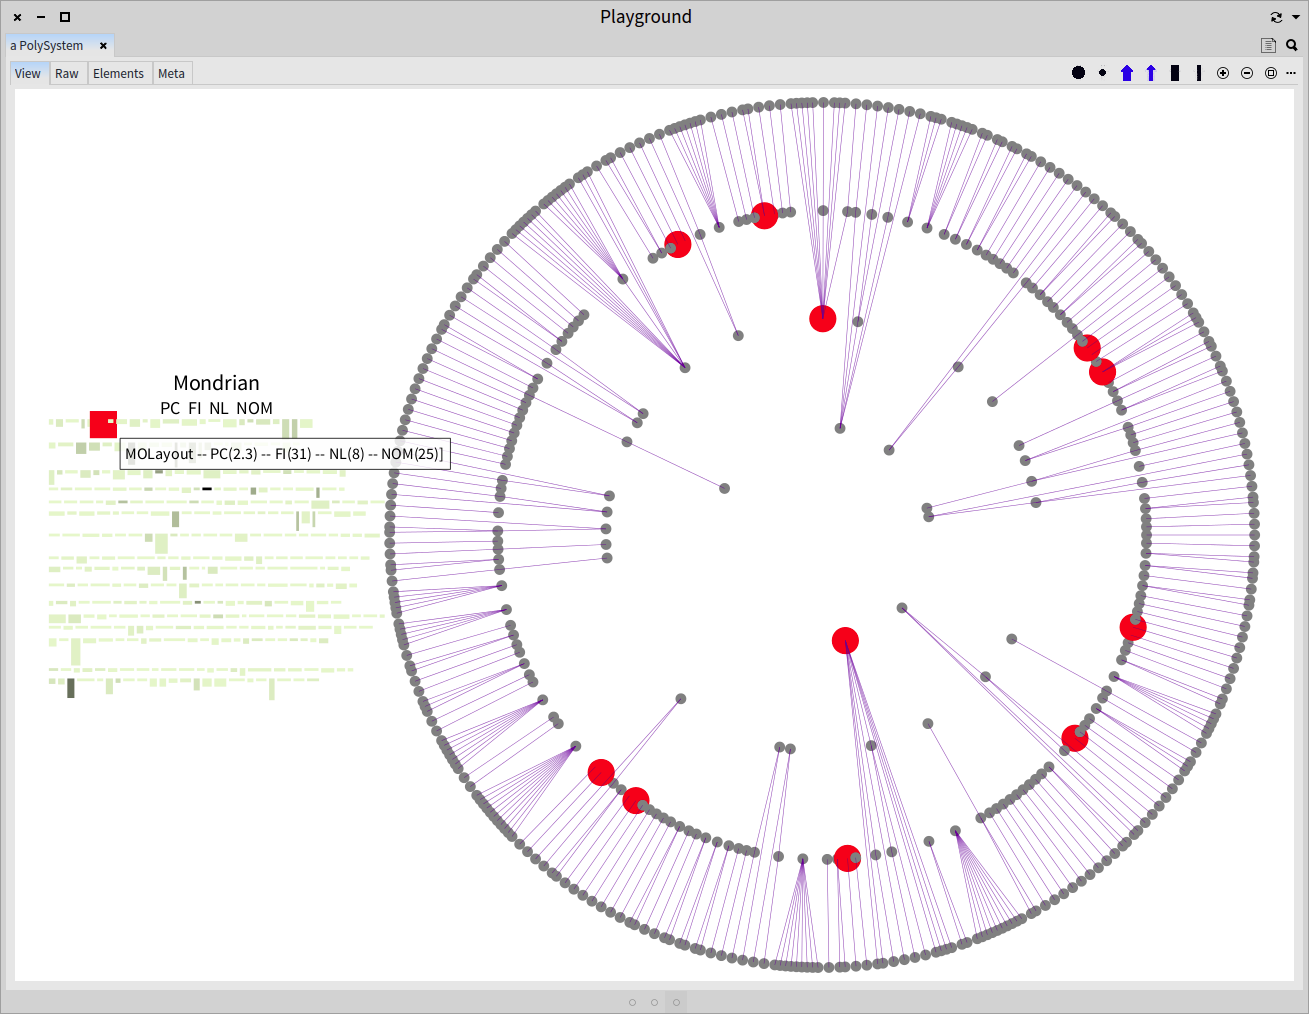
Users of Explora benefit from metric-specific visualisation, such as the ones below developed for the analysis of subtype polymorphism.
How to Install
-
Download and launch the Pharo;
-
Load Explora into Pharo by evaluating:
Gofer new package: 'ConfigurationOfExplora2'; url: 'http://smalltalkhub.com/mc/merino/Explora2/main' username: '' password: ''; update. (Smalltalk at: #ConfigurationOfExplora2) loadDefault -
Obtain Object Model Snapshots (OMS) of the corpus by following Pangea instructions.
Screencast
Tool paper accepted at VISSOFT 2015
"Explora: A Visualisation Tool for Metric Analysis of Software Corpora" preprint