The Moldable Inspector
Answering run-time questions in object-oriented systems involves reasoning about and exploring connections between multiple objects. Different developer questions exercise different aspects of an object and require different kinds of interactions depending on the relationships between objects, the application domain and the differing developer needs.
Object inspectors are the essential tools often used to reason about objects as they give direct access to object state. Traditional object inspectors, however, favor a generic view that focuses on the low level details of the state of single objects. This leads to an inefficient effort when answering specific questions about specific objects from specific domains.
The Moldable Inspector is a novel extensible object inspector that addresses this problem by:
- allowing developers to look at objects using multiple interchangeable presentations, tailored to the domain of the objects and the run-time question at hand;
- providing a workflow in which multiple levels of connecting objects can be seen together
Next we will emphasise what makes this inspector different, introduce the current prototype and provide several usage scenarios.
Offer multiple presentations
Objects are not created equal. And every object is interesting from multiple points of view, too. As a consequence, a one-size-fits-all interface does not do them justice.
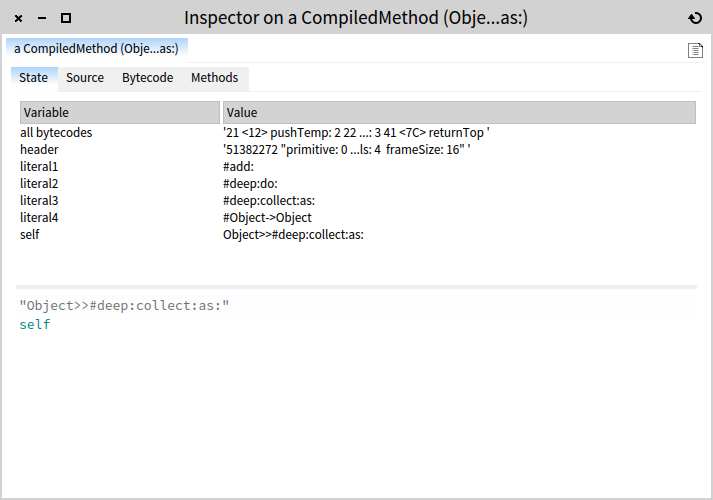
The Moldable Inspector solves this problem by providing multiple interchangeable presentations for every object. By default, every object has a presentation showing a generic instance variables plus a small workspace. For example, below you can see the inspector opened on a Object>>#deep:collect:as: compiled method.
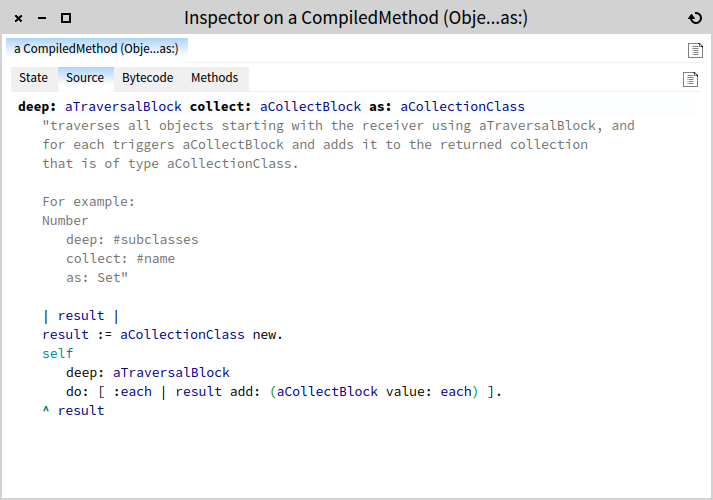
But, when reaching an object representing a compiled method, one might also want to see its source code. Or its bytecode. These are all presentations that can be switched to dynamically during inspection. For example, you can see below the source code of the Object>>#deep:collect:as: method.
Show more than simple presentations
Objects can have complicated states, and these should be shown easily.
As seen above, the source of a compiled method appears with syntax highlighting in a dedicated presentation, and collections are displayed as a list. But, depending on the situation, you want more than simple presentations like a table or text.
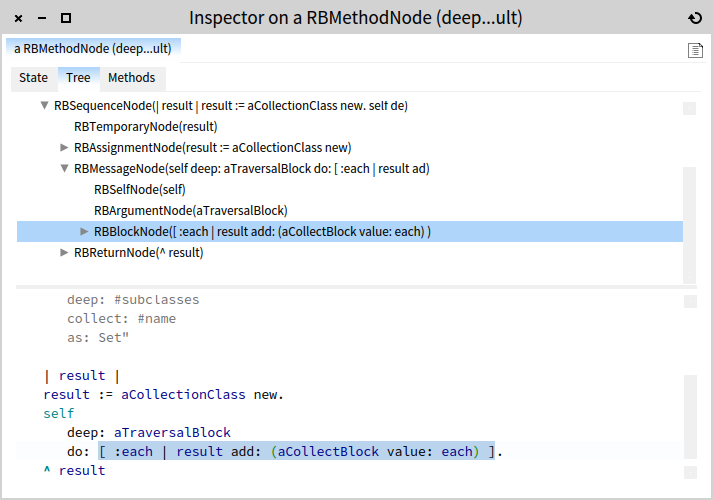
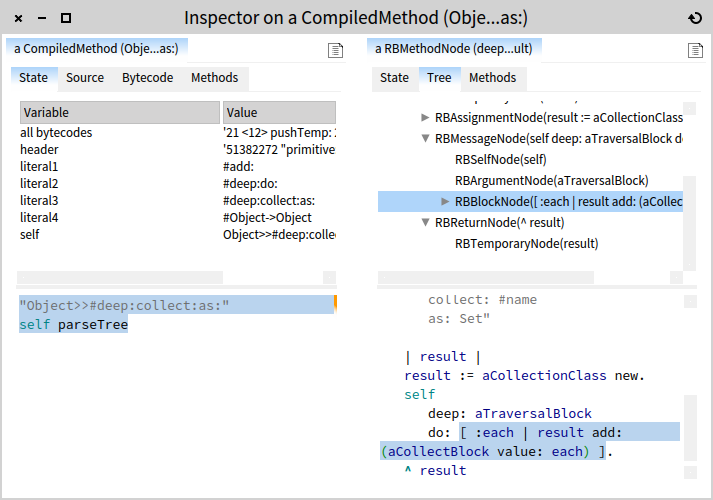
Consider the case of the abstract syntax tree of a method. If you want to learn how to query abstract syntax trees in general, you need to understand how they map to the code. The inspector helps you with a dedicated browser. For example, below you can see the inspector on a method node resulted by executing (Object>>#deep:collect:as:) parseTree. In this case, selecting a node in the tree above highlights the corresponding source code at the bottom.
PetitParser offers another example. Specifically, when building parsers using PetitParser, you want to play with them and investigate their behavior. To this end, PetitParser provides a dedicated browser that enables you to build full parsers in a class. But, when working in a workspace, you cannot benefit from this tool. The inspector offers the same sampler workspace possibility as in the PetitParser browser, only this time it lets you try samples on any parser instances. For example, below you see the result of inspecting the following parser:
natural := (#digit asParser plus flatten trim) name: 'natural'.
e := (($e asParser / $E asParser) ,
    ($- asParser / $+ asParser) optional , natural) name: 'e'.
number := (($- asParser optional ,
     natural ,
    ($. asParser , natural , e optional) optional) flatten) name: 'number'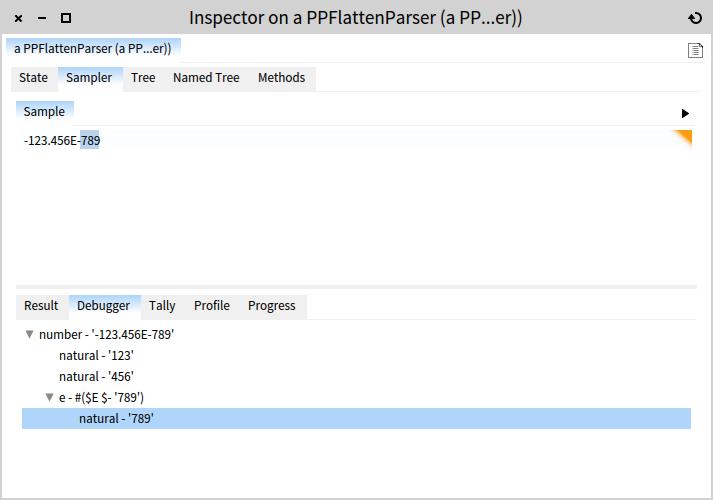
Show connected objects
In regular inspectors, the next objects are shown in either a separate window, or by replacing the existing pane. The Moldable Inspector is based on the Miller columns technique (also seen in Mac OS X Finder) and it shows the next selected objects to the right.
One consequence of this design is that one inspector window holds one drill down session, and the programmer can at any time navigate through the steps to figure out how the current object was reached. It's true: the chosen design consumes more space. However, it provides for a fluid interaction and offers complete overview over the session history. This is particularly important when drilling consists of more than five or so steps.
But, the surprising feature of showing the connected objects in a finder-like interface is the support for creating simple workflows.
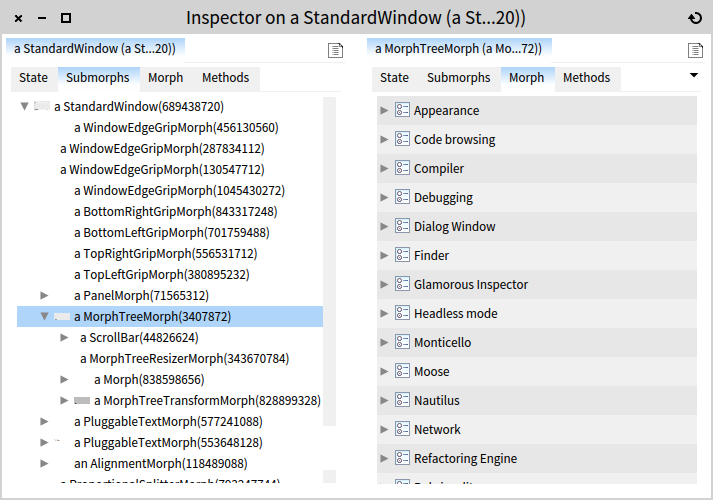
For example, when searching for a morph (a morph is an object modelling a graphical component) in a tree of submorphs, you might want to see the enlarged visual representation of each morph. Below you can see how navigating through the submorphs tree of the system preferences window. This is particularly useful for debugging purposes.
Another use case is when you have a collection of items that you want to preview. If you want to get a quick way of choosing from a collection of icons, you can construct a collection with the desired items, and simply browse through them. For example, below you see the inspector showing the collection of icons that comes in the GLMUIThemeExtraIcons icons. When an item is selected, you can preview the visual representation of the form object to the right. Because our collection is a dictionary, once you like an icon, you can simply use the name of the corresponding icon.
![]()
Make code part of the inspection workflow
Like in any Smalltalk inspector, you can write and execute code specific to the inspected object. For example, if you have a CompiledMethod you can execute self parseTree to obtain the abstract syntax tree. The classic approach is to spawn another window when you desire to inspect the result of the executed code. In the Moldable Inspector, you have another option: spawn it to the right (select and Cmd+o). After all, clicking on an instance variable is no different in intent then navigating to another object obtained by sending a message. The user interface should offer uniform manipulation.
To get a more concrete idea, here is how it looks when evaluating and opening the snippet to the left on a compiled method: the node is opened to the right with all interactive features.
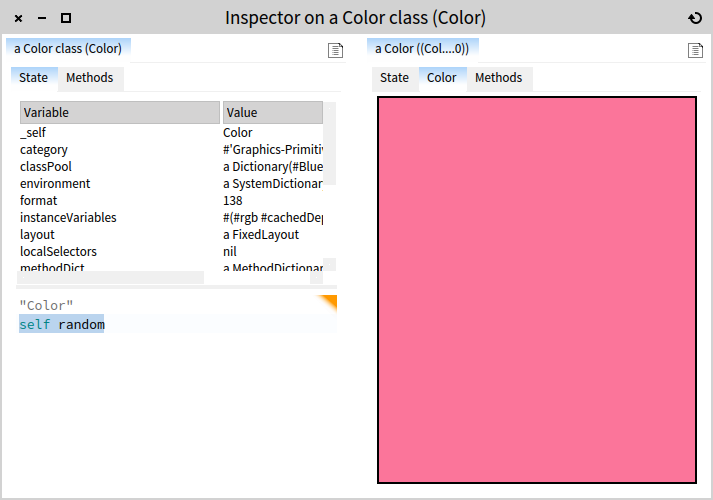
With this approach, you get no new disconnected windows, and you can integrate interaction with custom code snippets arbitrarily into one single cohesive session. For a fun example, imagine you want to choose a color for a user interface. One way to do it is let serendipity play a role in it. You can inspect Color and then send self random. By opening to the right repeatedly (just press Cmd+o continuously), you can construct a little inspiration tool.
Show code next to objects
Code is traditionally constructed in the class browser. However, in a Smalltalk-inspired environment, developers tend to think in terms of live objects. For this reason it would be natural to have code available in the midst of objects, rather having it only segregated in a separate tool. To remedy this problem, the inspector offers the code next to any object in a dedicated presentation.
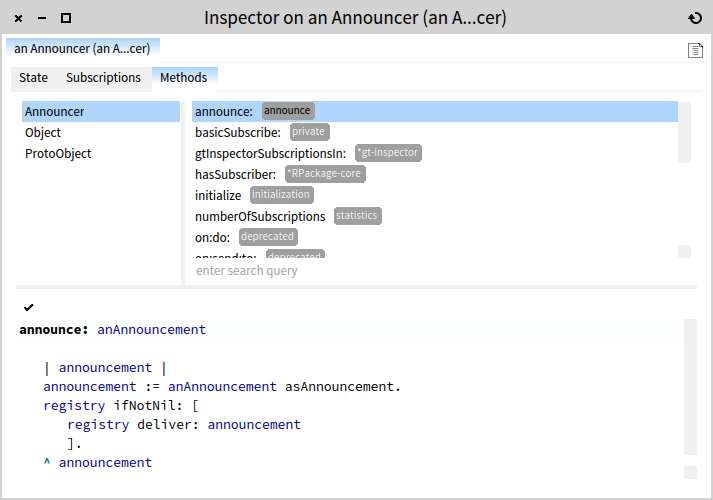
For example, below you can see the browser opened on an Announcer object. The top left pane shows the inheritance hierarchy in reverse order, the top right pane shows the methods in the class, while the selected method is shown at the bottom.
There at least two scenarios in which this feature is useful. First, when playing with objects, you sometimes need to quickly lookup methods from that object. When this happens, you can just switch to the methods pane, and lookup the code.
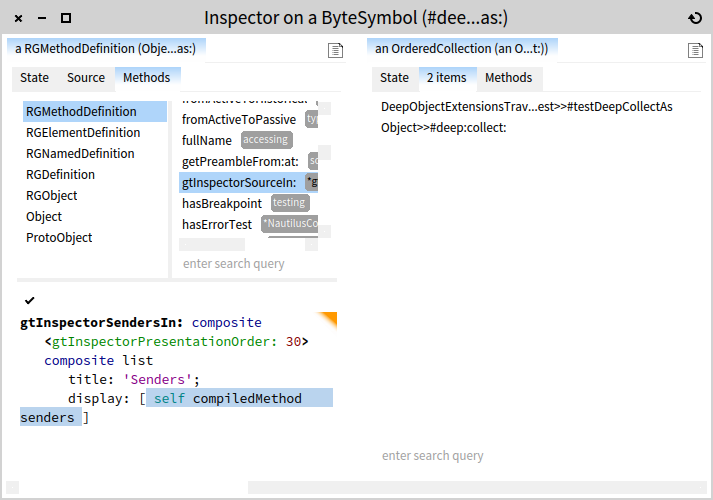
Second, you can develop code right in place. The current browser is rather limited and it has to see significant improvements, but it already exhibits interesting abilities. It is not where you want to spend all coding time, but some things are better done fast and in place. In particular, because the code editor binds self to the object, you can use it as a workspace, too, and can execute code and preview the result. Writing code within the context of an object enables fast prototyping.
For example, the inspector below shows a code editor in the context of an RGMethodDefinition class. Selecting self compiledMethod senders spawns the collection to the right.
GTInspector
The GTInspector implements the ideas behind the Moldable Inspector as part of the GToolkit project. It is available in the latest Moose image which can be downloaded from the Moose website. It is also integrate in Pharo.
Usage scenarios
Files are everywhere, and almost all applications deal with them in one way or another. They read from files, they write to files, they manipulate files. Given the importance of files, it is very likely that you will end up needing to explore problems related to these files. Having a powerful file library is important, but when you play with files you might want to explore them visually, like you can do it at the operating system level. The GTInspector supports this use case. The trick is to see files as objects. Take a look. (more information can be found here)
Constructing and previewing queries over relational databases is typically done in dedicated DB client tools that are far away from the development environment. However, when working with relational data, querying is a common activity in software development, and thus it should be supported more prominently by the IDE. The GTInspector offers a simple set of extensions for querying and visualising databases. (more details here)
Authors
| Andrei Chiş | |
| Aliaksei Syrel | |
| Tudor Gîrba |
Publications
The Moldable Inspector: a framework for domain-specific object inspection