Qualitas Corpus Metrics Analysis
What?
A metric-based analysis for Qualitas Corpus. Specifically, I developed a set of charts to depict LOC, NOM, NOC and NOP values for 85 systems from Qualitas Corpus, afterwards I analysed the results and found some characterisations.
Why?
Developers often ask questions such as how many LOC are too many?, how many classes are too many?, how many methods are too many?. They want to design easily maintainable software. But as a software evolves and normally grows it is not clear how it does so. Larger software have more packages?, or the same amount of packages but more classes?, or maybe methods tend to be larger?. It is clear that more lines of code must be added but not clear how these lines are going to change the shape of the software.
How?
Installation
MCHttpRepository
    location: 'http://smalltalkhub.com/mc/merino/SoftwareAnalysis/main'
    user: ''
    password: ''
The files that the following scripts use can be downloaded from here
First attempt
I collected the data using Explora's workbench, that allowed me to obtain the sum of LOC, NOM, NOC and NOP for each system. In this first approach I extracted averages using the following code:
|numberOfPackages numberOfClasses numberOfMethods numberOfLinesOfCode|
numberOfPackages := (eachModel allNamespaces reject:#isStub) size.
numberOfClasses := (eachModel allModelClasses reject:#isStub) size.
numberOfMethods := (eachModel allMethods reject:#isStub) size.
numberOfLinesOfCode := eachModel allMethods sum:#numberOfLinesOfCode.

Array with: numberOfPackages
        with: numberOfClasses
        with: numberOfMethods
        with: numberOfLinesOfCode
The result is a Dictionary where keys are system's name and values are Arrays composed by avg NOC per package, avg NOM per class, avg LOC per method and LOC. This object was serialised with FUEL (file here).
I developed a chart using Roassal. In the X-axis we placed the systems and in the Y-axis are measured the metrics. I used different colors to depict each metric, so I can compare all of them in the same chart. This first chart summarise the metrics by calculating the average values for each metric, e.g. I counted all classes in the system and divided it by the number of packages which produces an average of classes per package. The result can be seen below (do it SACharts firstAnalysis):
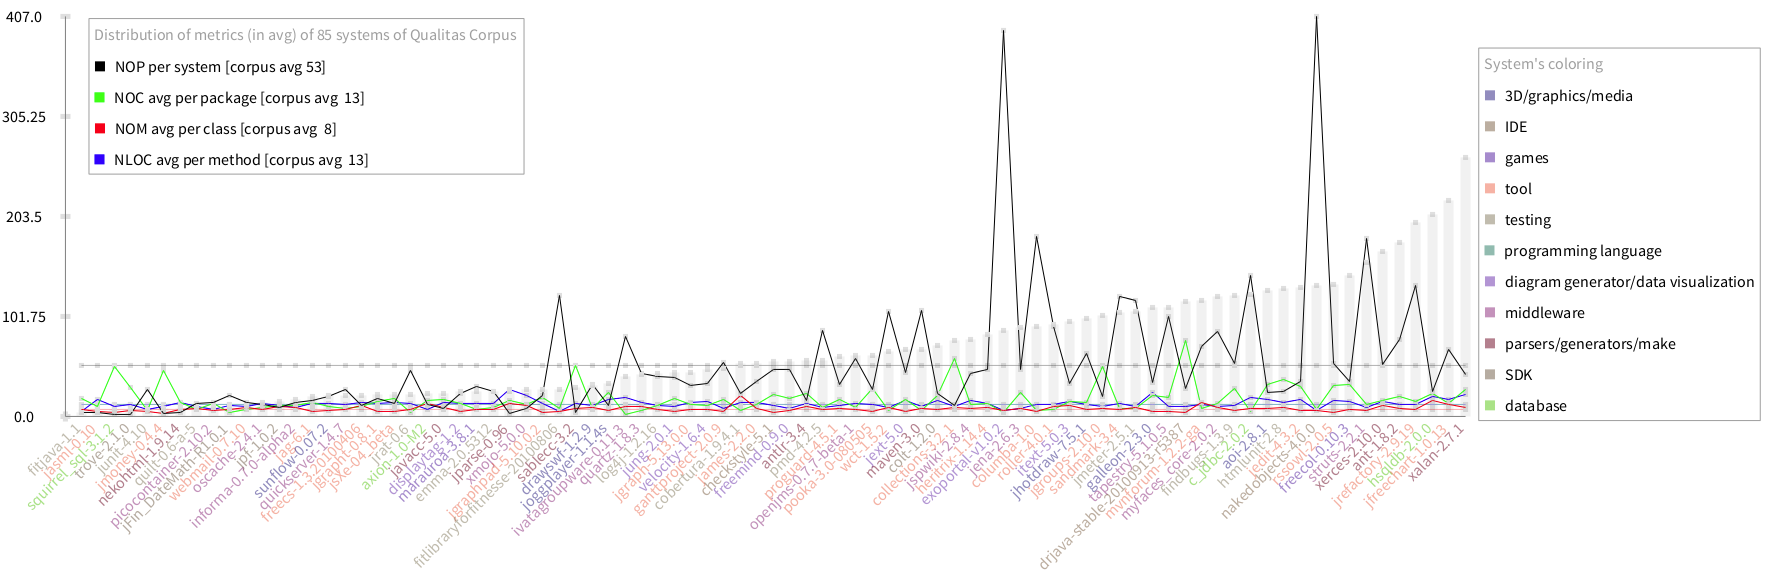
After discussing this with Mircea and reading about using average as a central tendency value in non-normal distributed data, I realised that the median should fit better.
Second attempt
I changed the script to collect the data accordingly:
|mooseGroupToCollection|
mooseGroupToCollection := [:group|
    |r|
    r := OrderedCollection new.
    group do:[:m| r add: m].
    r isEmpty ifTrue:[0] ifFalse:[r median] ].
Array
    with:   eachModel name
    with: (eachModel allNamespaces reject:#isStub) size
    with: (mooseGroupToCollection value:((eachModel
        allNamespaces reject:#isStub) collect:[:p| p classes size]))
    with: (mooseGroupToCollection value:((eachModel
        allModelClasses reject:#isStub) collect:[:p| p methods size]))
    with: (mooseGroupToCollection value:((eachModel
        allMethods reject:#isStub) collect:[:p| p numberOfLinesOfCode]))
    with: ((eachModel allMethods reject:#isStub) sum:#numberOfLinesOfCode)
Below is the same visualisation with the new dataset (do it SACharts secondAnalysis):
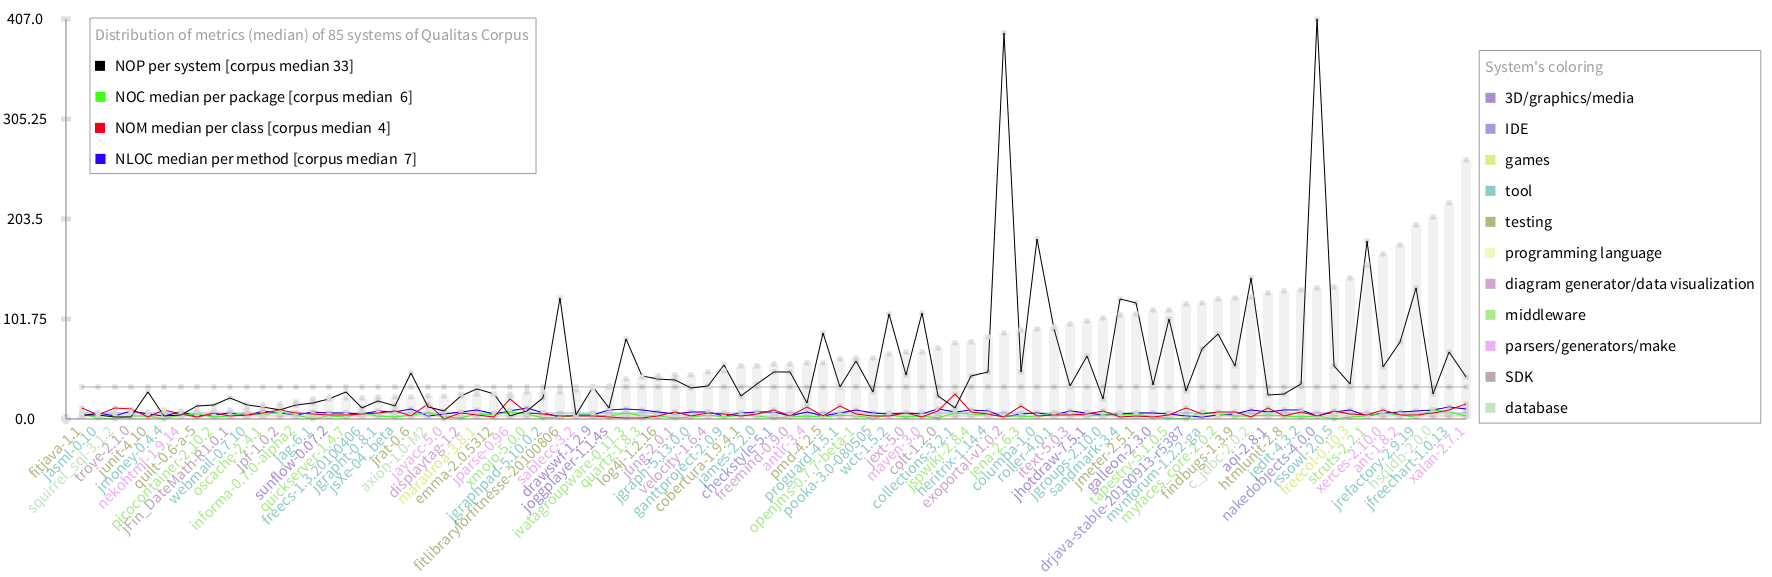
Analysis
The chart seems interesting. However it only allow me to analyse NOP. The chart shows some outliers regarding this metric such as fitlibraryforfitnesse, exoportal and nakedobjects. The larger the systems (in terms of LOC), the higher the NOP. Which is expected, systems grow by adding more packages to the system. However, the variance of NOP seems high (TODO: calculate it). I depicted the median NOP (is 33) showing that the median is not affected by the outliers. Note that the median NOP of the largest systems is very close to the median of the corpus.
Finally, the scale does not benefit the analysis of NOC, NOM and LOC. The values of theses metrics are too low with respect to the scale, so it is difficult to see the lines. even more to compare it with the median of the corpus. However, the visualisation allows the user to zoom in, I preferred to change the scale and remove NOP from the chart to concentrate on the rest of the metrics. The result of this is showed below (do it SACharts thirdAnalysis):
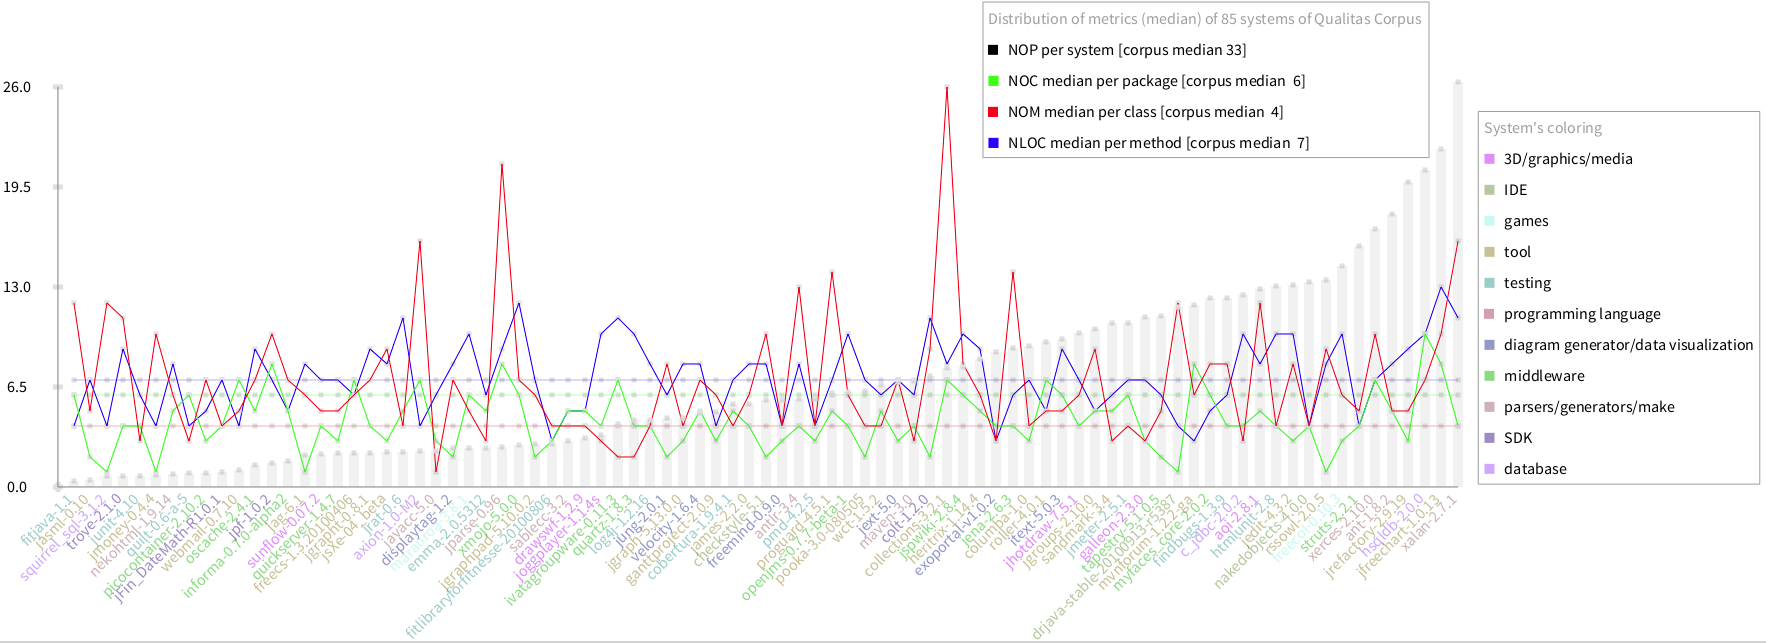
The analysis of this chart shows that the variance of NOM is higher than NOC and LOC. Some outliers are found such as axion, jparse and collections. There are some characterisation that can be extracted regarding these metrics on systems:
| Characterisation | System | LOC | NOM | NOC | NOP | Comments | |
| Smell [refactor methods] | ivatagroupware | VERY HIGH | VEY LOW | HIGH | * | A system where the number of classes per package is around the expected (median of the corpus) but each class has a very few methods and each method has too many lines | |
| Smell [refactor classes] | collections | HIGH | VERY HIGH | HIGH | * | A system where the number of classes per package is around the expected (median of the corpus) but each class has too many methods. However, methods have an expect number of lines of code | |
| Plugin | squirrel | VERY LOW | VERY HIGH | VERY LOW | * | A system where the number of classes is too low. Each class has too many methods but those methods have just few lines of code | |
| ? | jayacc | LOW | VERY LOW | VERY LOW | * | A little system? | |
| Smell [refactor packages] | rssowl | HIGH | VERY HIGH | VERY LOW | * | A system where packages have very few classes, but each class have too many methods and methods have many lines of code |
Now, a proper question is what are the number for other languages. Are the values of these metrics similar among different languages?. So, we took a Moose 5.0 beta image which comes with several Smalltalk (Pharo) applications and run the same experiment. In this case I am only interested in the mean value of NOC, NOM and LOC. The following code retrieve these values:
|nom loc noc nop|
classes := Smalltalk globals values select:#isClass.
nom := (classes collect:[:e| e methods size]) median.
loc := (classes flatCollect:[:e| e methods collect:#numberOfLinesOfCode]) median.
noc := ((classes collect:#package) asSet asOrderedCollection
                    collect:[:e| e classes size]) median.
nop := (classes collect:#package) asSet size.
Array
    with: nop
    with: noc
    with: nom
    with: loc
The following table compares the results of these metrics between Java and Smalltalk
| Language | Data Source | NOP | NOC | NOM | LOC | |
| Java | nakedobjects-4.0.0 | 407 | 4 | 4 | 4 | |
| Java | exoportal-v1.0.2 | 393 | 3 | 4 | 3 | |
| Java | columba-1.0 | 184 | 4 | 3 | 7 | |
| Java | Qualitas Corpus (85 systems) | - | 6 | 4 | 7 | |
| Smalltalk | Moose 5.0 beta image | 498 | 7 | 6 | 4 |
Here I took the whole Moose image as one system. If I compare the median values for the Java corpus with the Smalltalk ones, as one can predict, Smalltalk methods are considerable shorter than Java methods but packages contain little more classes and each class has more methods. If I take the three higher ranked Java systems NOP wise, I could think that NOP is a good predictor for lower measures of NOC, NOM and LOC meaning that systems that contain more packages are normally better modularised having few classes per packages, few methods per class and few lines of code per method.