Software Visualization Ontology
Inbtroduction
Ontologies are formal and explicit descriptions of concepts in a domainGrub93a. Ontologies can help to:
- share common understanding of the structure of information among people or software agents,
- item reuse domain knowledge, enforce domain assumptions,
- separate domain knowledge from the operational knowledge, and
- analyze domain knowledge.
Through a software visualization ontology we aim to encapsulate the main characteristics of proposed software visualizations such as tasks, techniques, and media to enable both textual and visual search methods that support developers. We believe that an ontology can help developers to find suitable visualizations for their particular problems, and also it can support researchers to reflect on the software visualization domain. In this section, we elaborate on early results of designing and implementing an ontology.
Background
An ontology is a formalization of a model to describe what is essential in a domain. That is, the ontology describes the concepts in the domain, which can define various properties and restrictions. Hence, an ontology that is populated with a set of individual instances of the concepts is usually referred as a knowledge base. However, defining what in the domain is modeled as a concept or an instance is subjective. We opted to follow the widely used guide proposed by Noy and McGuiness. We now elaborate on how we addressed their suggested steps to create our software visualization ontology.
Step 1. Determine the domain and scope of the ontology.
- What is the domain that the ontology will cover? Software visualizations.
- For what we are going to use the ontology? To allow 1) developers find suitable visualizations for their particular concerns, and 2) researchers reflect on the software visualization domain.
- For what types of questions the information in the ontology should provide answers? Questions that identify particular software visualizations that fulfill the restrictions imposed by the context of the developers needs.
- Who will use and maintain the ontology? Software developers willing to adopt visualizations, and who have used a visualization from the ontology and want to add new supported questions to it. Also, researchers who want to add new data to the ontology for a new or an existing indexed visualization approach.
Step 2. Consider reusing existing ontologies.
To the best of our knowledge this is the first ontology of software visualizations.
Step 3. Enumerate important terms in the ontology. We include the characteristics of software visualization and their evaluations presented in a previous study .
Step 4. Define the concepts and the concept hierarchy.
We opt for a bottom-up development process in which we start from instances of proposed software visualizations. For each, we identify the various concepts involved its context (e.g., tasks, media, environments, frameworks, questions, evaluation strategies). We define a hierarchy of concepts following an is-a relation. When defining the concepts we avoid to create cycles, and validate that siblings concepts (that are at the same level in the hierarchy) correspond to the same level of generality.
Step 5. Define the properties of concepts.
We characterize the concepts based on their properties. For instance, for the concept medium we define the dimensionality (eg 2D/3D) property. Then, when we define particular software visualizations as instances in the ontology, we can specify a medium and its dimensionality. Thus, researchers can use the ontology to investigate, for instance, the correlation between evaluation strategies and visualizations that use visualization techniques of a higher dimensionality displayed on a medium of a lower dimensionality.
Step 6. Define the restrictions of the properties.
We only use restrictions to define disjoint concepts.
Step 7. Create instances.
We create instances in the ontology for each proposed software visualization in our data set. Thus, visualization tools are the materialization of a combination of property values of concepts.
Protégé
We implement our ontology using Protégé, a popular, free, and open-source framework for the design and use of ontologies. In it, we define the concepts (in the tool called classes), properties, restrictions, and instances.

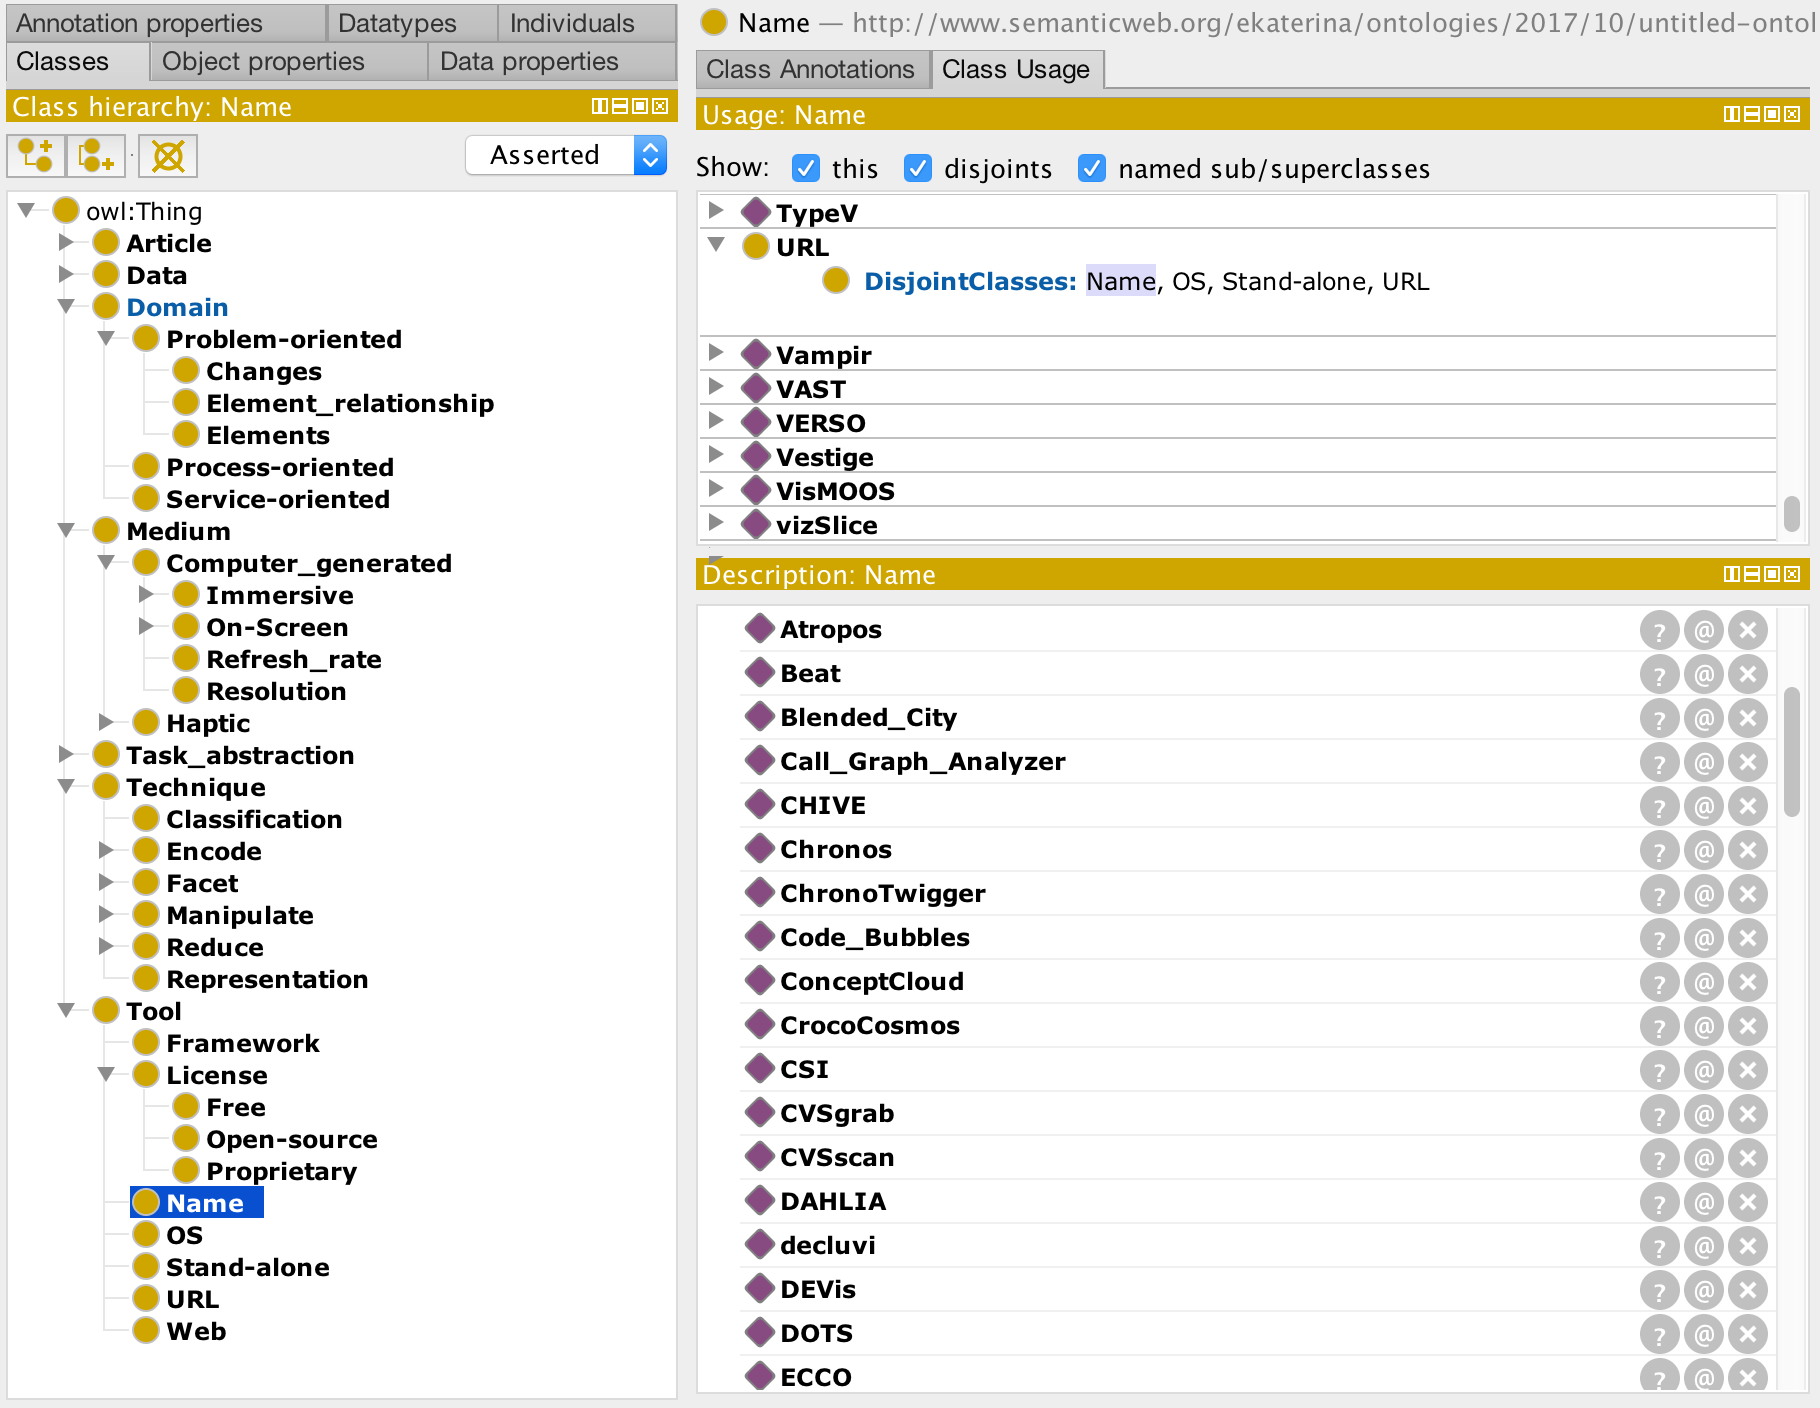
The figure above shows the classes view in Protégé with a detail of the hierarchy of concepts. We selected the name of the tools' concept, which are listed in the right pane.

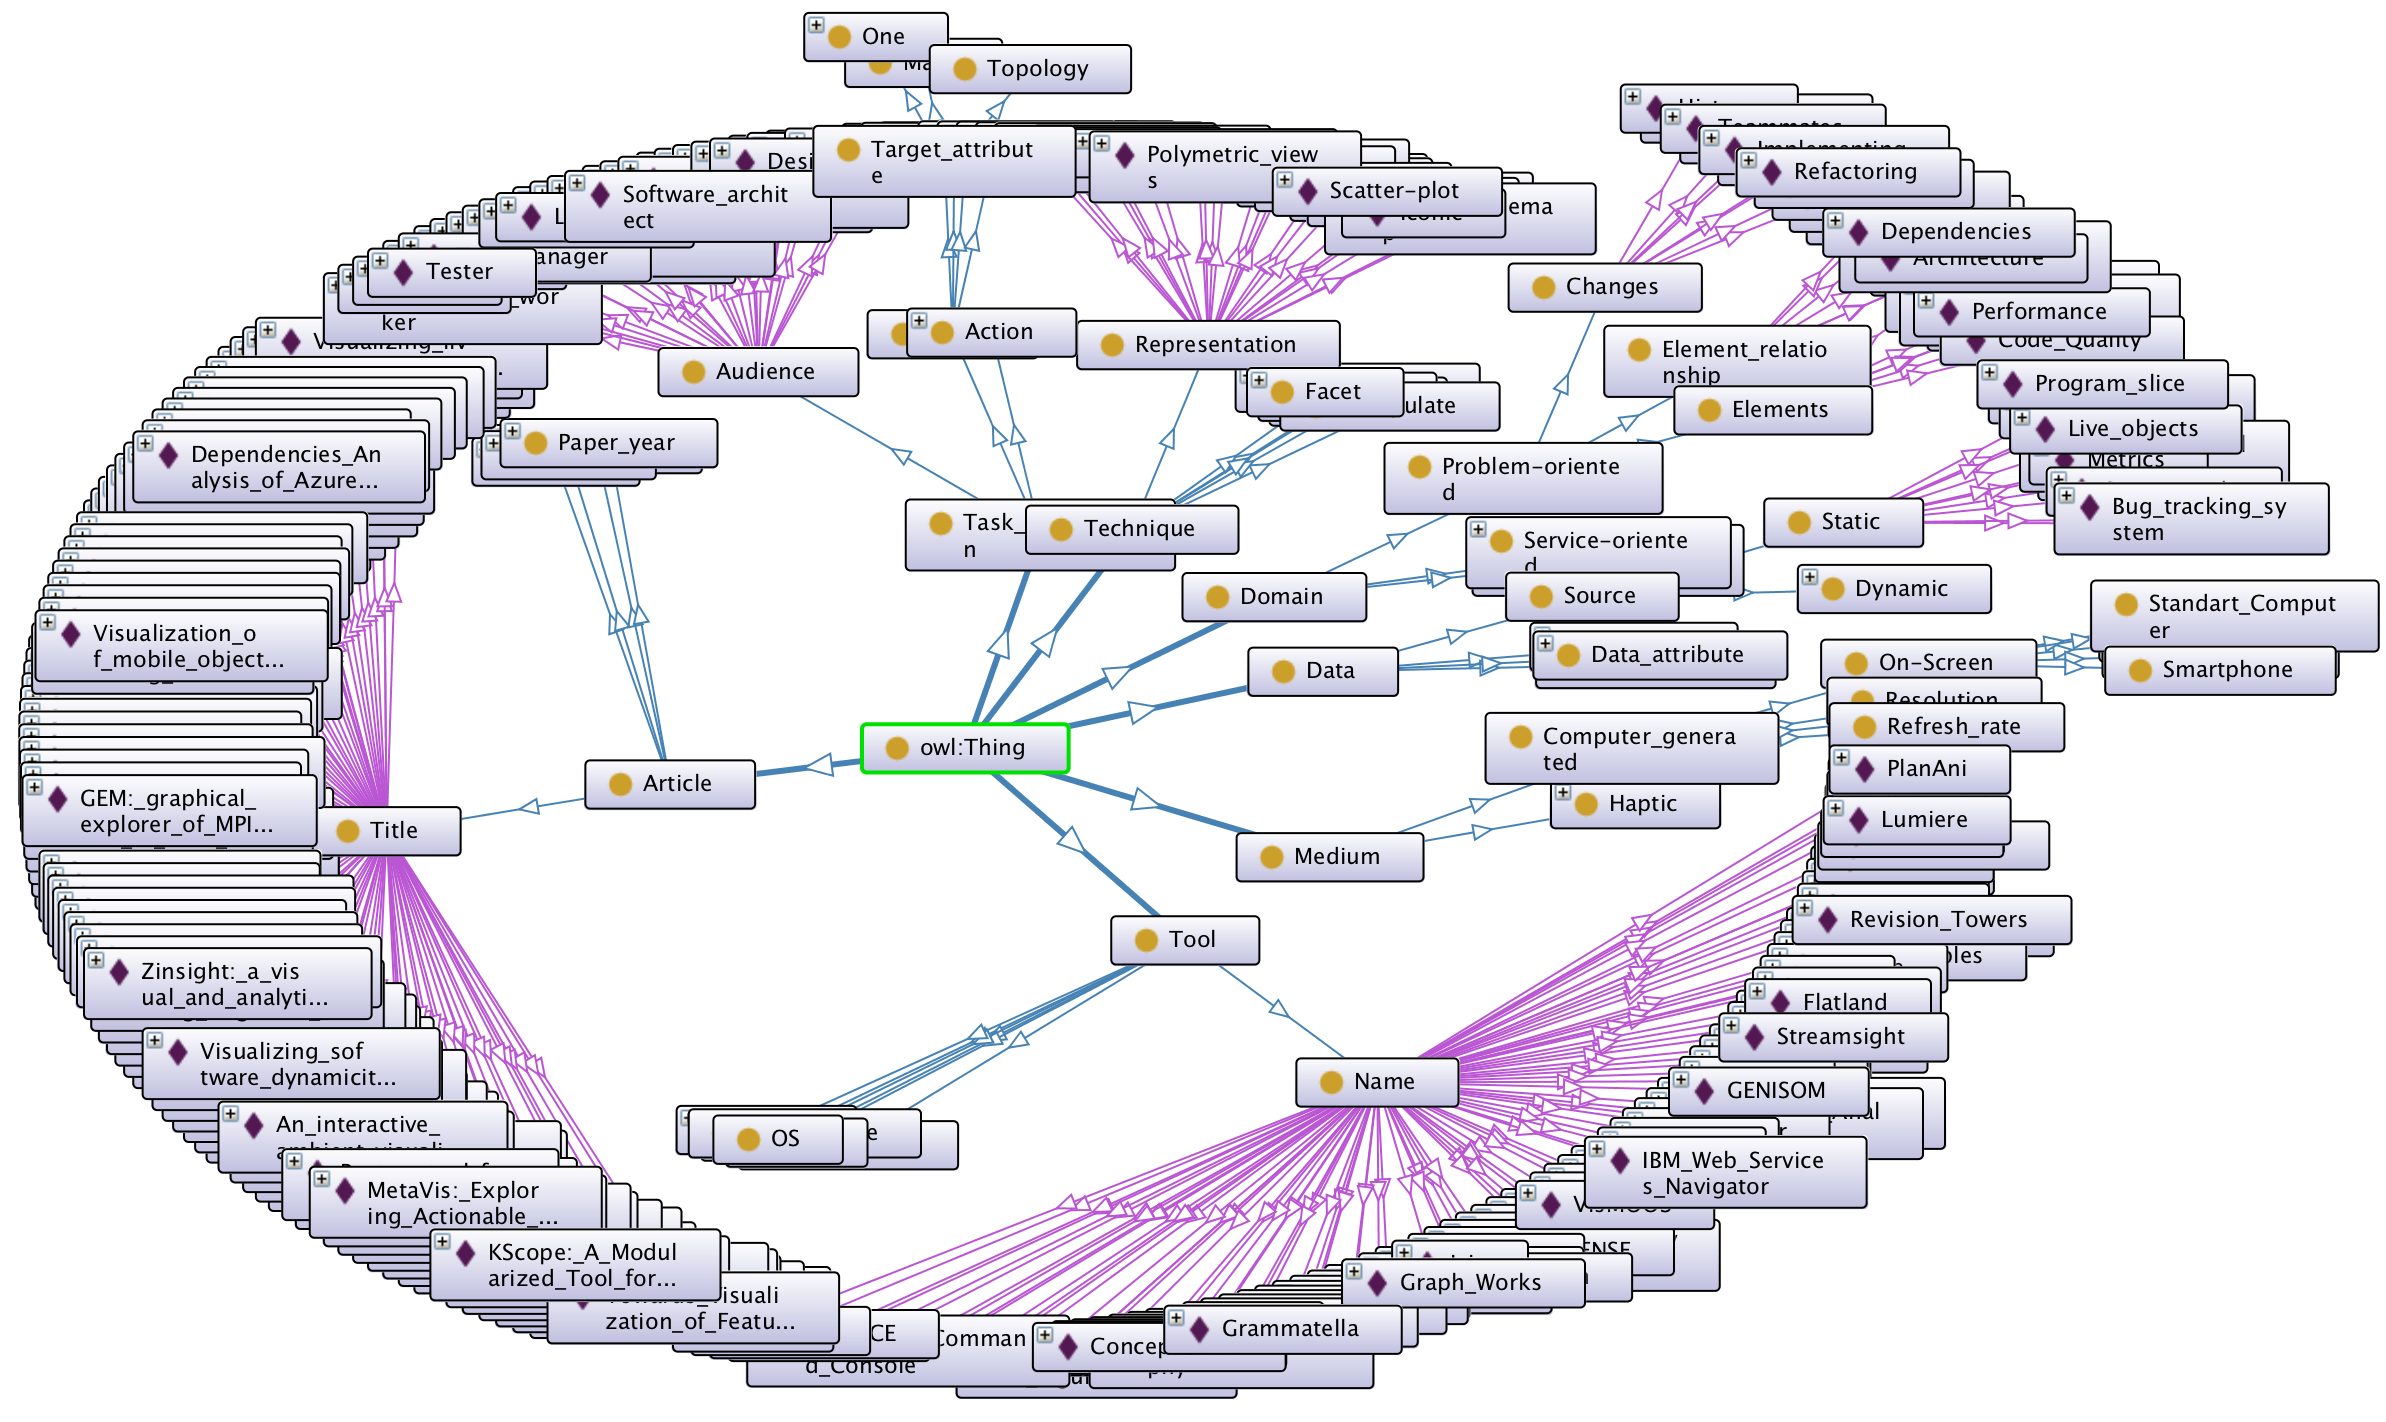
The figure above shows an overview of our implementation of the concepts hierarchy using the OntoGraf visualization plug-in including in Protégé.
Usage Scenarios
We have developed an initial ontology.
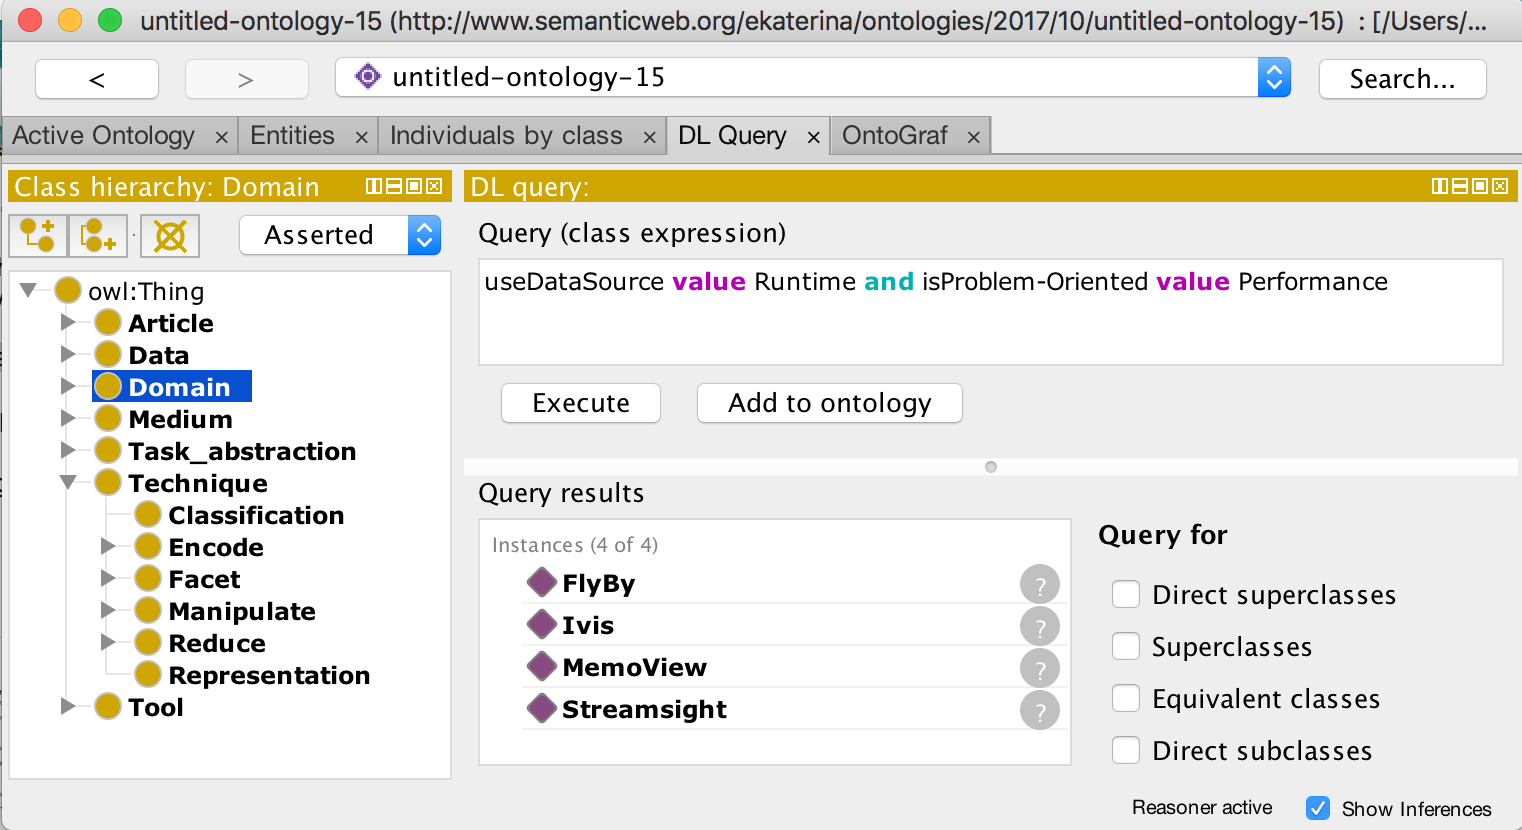
Scenario 1. Find suitable visualization tools that support the analysis of performance issues at runtime.
To two concepts are defined in the specification of this need:
- the source of the data is the runtime, and
- the problem dealt is the performance of the software system.
We translate this specification to the syntax specified by the ontology web language (OWL). The figure below shows the resulting query, and the suitable tools returned.

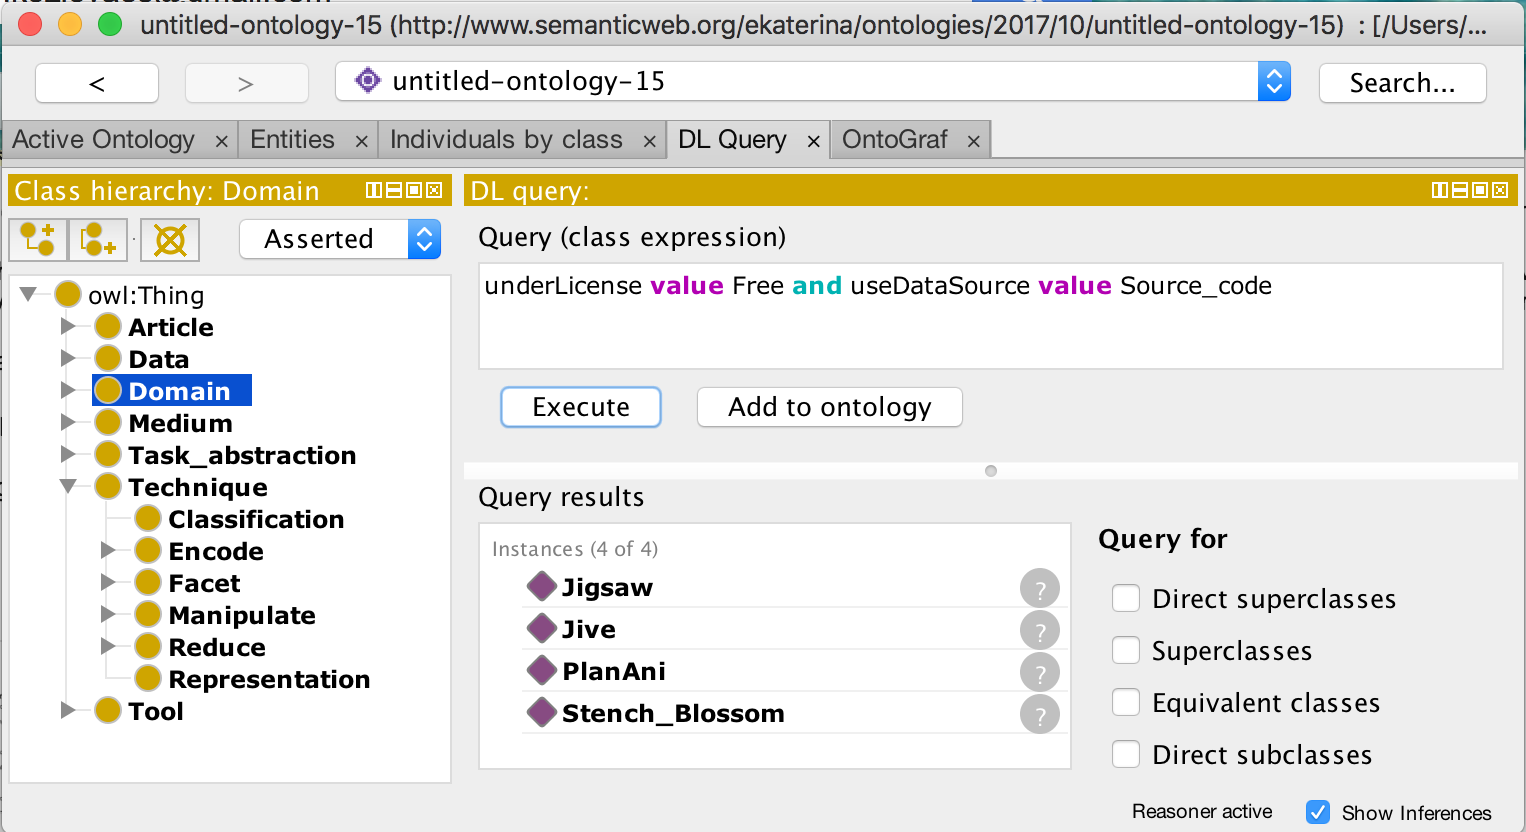
Scenario 2. Find visualization tools under a free license that support the analysis of source code.
Similarly, the specification of this need defines two concepts:
- item the license of the tool has to be free, and
- the source of the data must be the data source of the software system.
We translate this specification to the syntax specified by the ontology web language (OWL). The figure below shows the translated specification of the need in the OWL syntax, and the suitable tools returned.

Summary
We motivated the need of a richer model to encapsulate the various characteristics of software visualizations. We argued that ontologies represent a suitable means for modeling for software visualizations. We elaborated on our experience when designing an ontology for software visualizations. We discussed our implementation of the ontology in the Protégé tool. Then, we demonstrated how the ontology can be used through basic usage scenarios. Although our implemented software visualization ontology contains only little data of a limited number of software visualizations, we expect it will grow when researchers in the field use it. In the future we plan to combine the previously described meta-visualization approach to our software visualization ontology.
Downloads
- VISON: Software Visualization Ontology (OWL format).
- Slides of initial results presented by a student at the software composition seminar.