Visualizing and Mining Stack Traces
Motivation
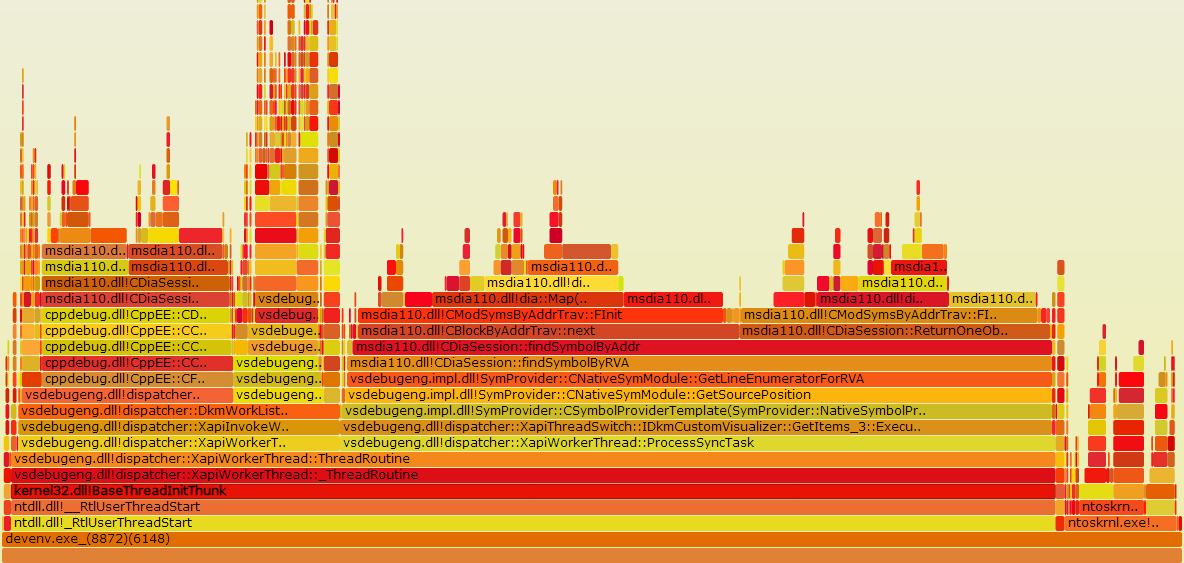
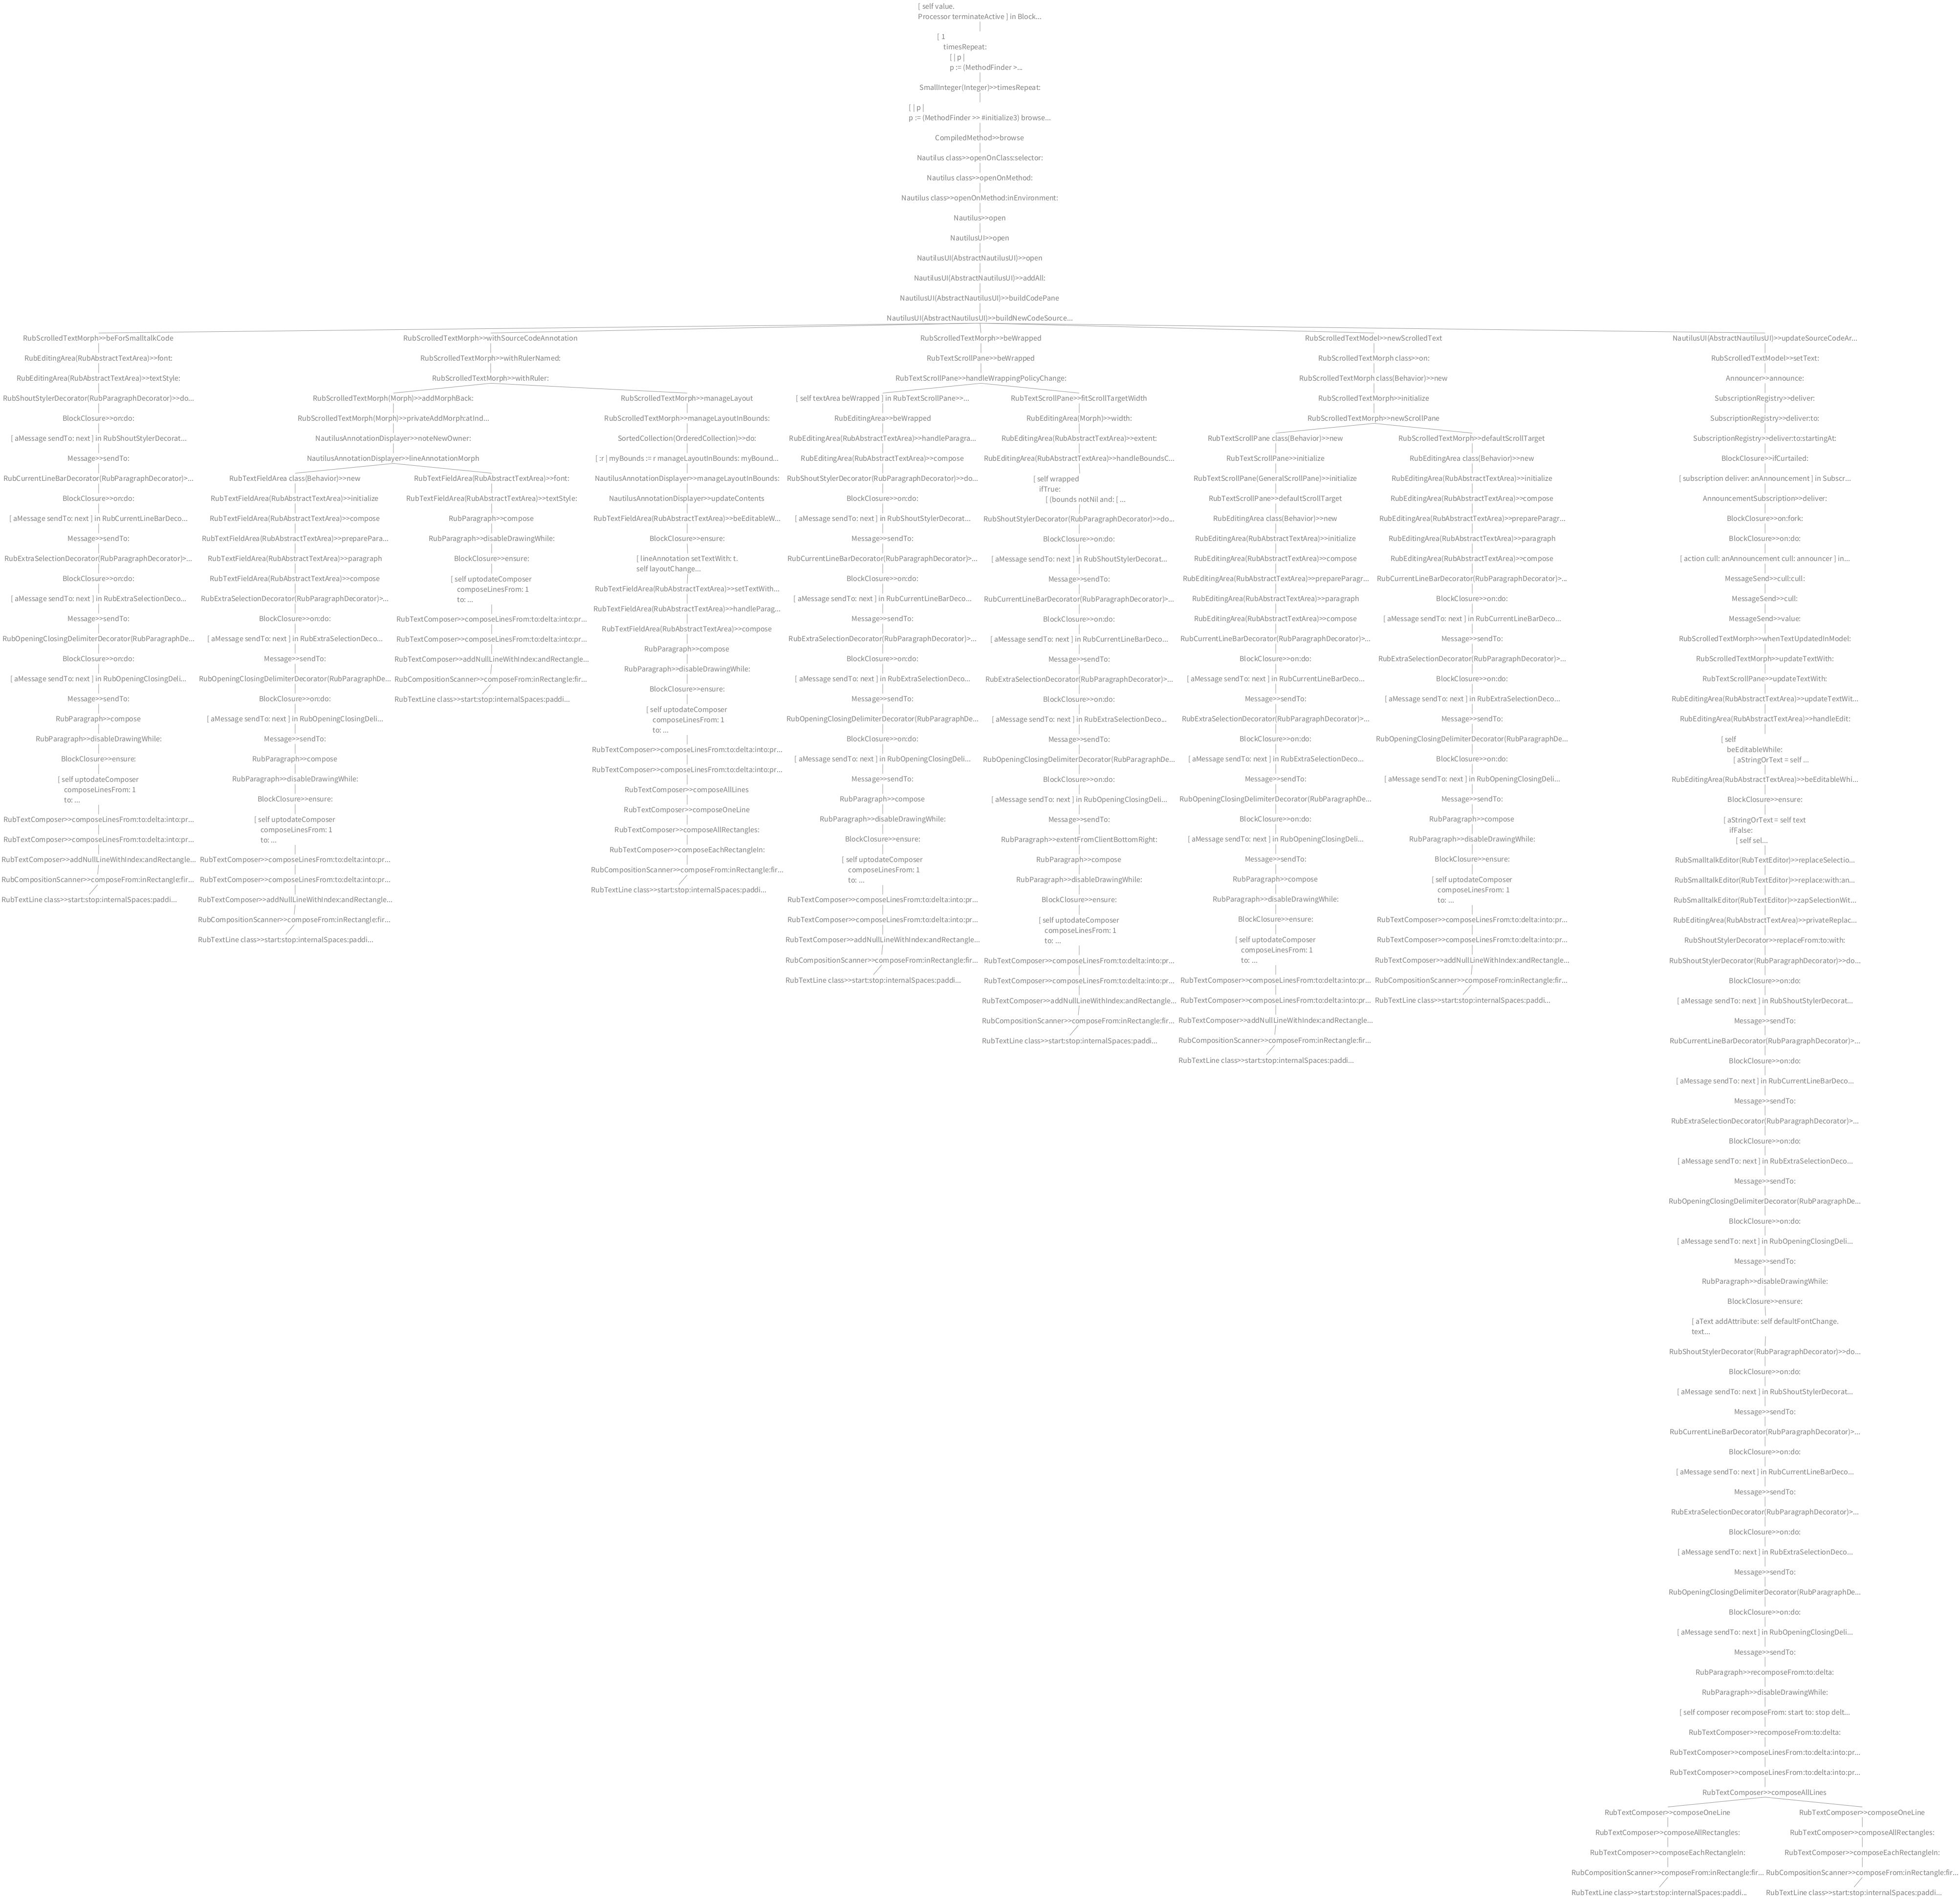
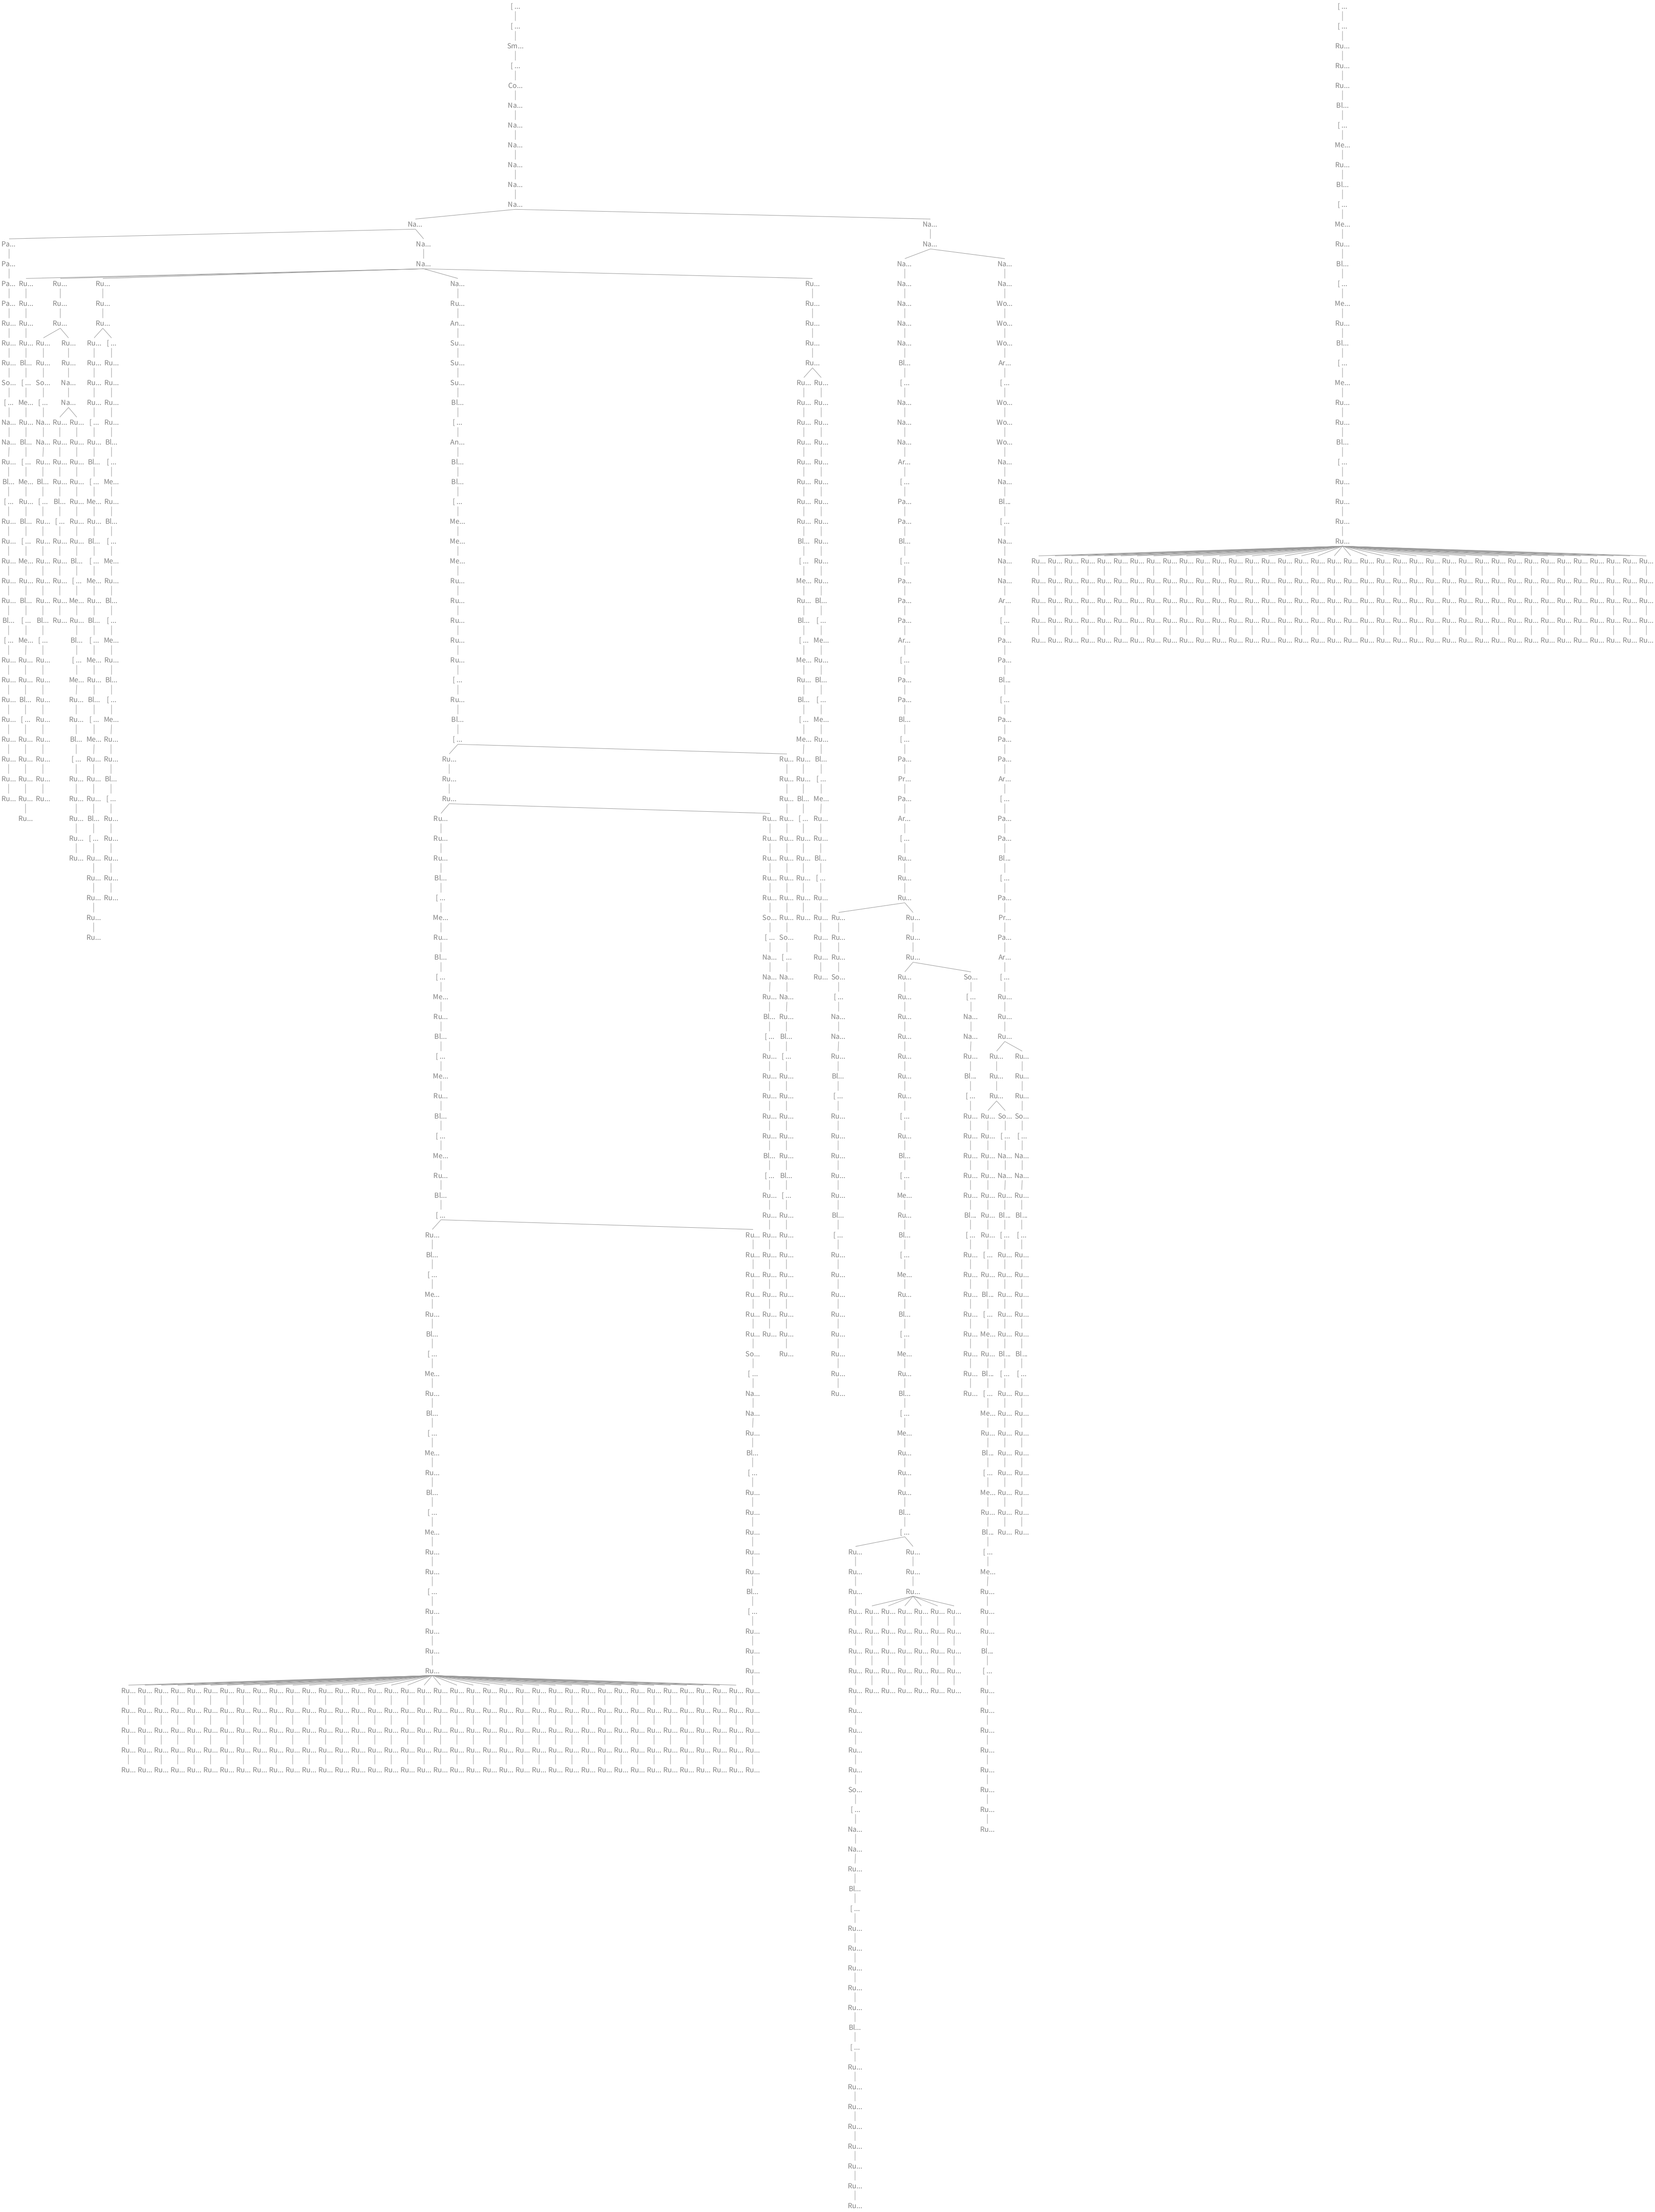
Profiling and debugging software can be challenging tasks. The stack of a program allows developers to track the sequence of nested methods called up to a certain point in the execution. These calls form a tree that contain valuable information useful when investigating bugs or doing performance improvements. Still, one stack trace is usually not enough. Collecting thousands of stack traces can provide better insight into the execution of a program, however, depending on their size and number, they can be hard to understand.
 |
 |
 |
Approach
In this project we will investigate visualization and mining techniques that ease the collection and understanding of stack traces. We will develop prototypes using Pharo (a Smalltalk inspired language) and Roassal (a visualization engine). The resulting visualization and techniques should support developers to identify places where branches diverge, assess size of branches and compare trees from different traces.
Research Questions
- What kind of visualization techniques are suitable for program stack understanding?
Further reading
-
[Pharo by Example](https://scg.unibe.ch/assets/scgbib/?query=Pharo by Example&filter=Year)
-
Roassal: http://agilevisualization.com
Contact Leonel Merino, Andrei Chiş