Visually Mining Event Data
Motivation
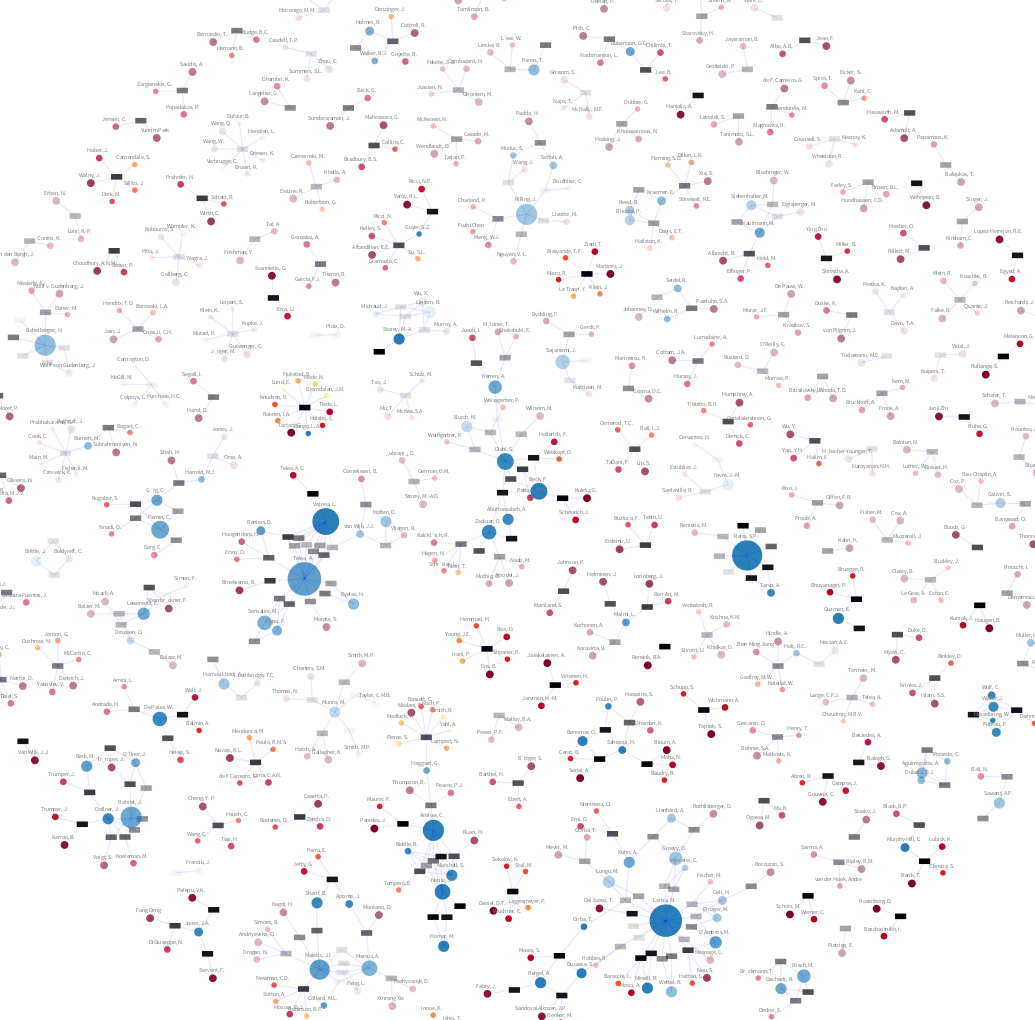
Proceedings published by an event such as a conference are interesting data for understanding how a community is composed and evolve in time. Authors collaborate among them in publications generating clusters. These clusters differ in shape, some of them are composed by few authors that consistently publish their work. In other cases, we can identify a central author that have many co-authors. Sometimes authors in a cluster have the same affiliation, while in others different organisations collaborate together.
Approach
Visualisation can be a great tool for analysing these communities. In this project, we will work building tools for extracting, modelling and visualissing the data.
Further reading
- Pharo: http://www.pharobyexample.org
- Moose: http://www.moosetechnology.org
- Roassal: http://agilevisualization.com
Presentation by Dominik Seliner — EggShell — a workbench for the assessment of modeling pipelines for scientific communities
Contact Leonel Merino